Energy management
The key area of the ORLEN Group's development in the next decade will be energy, based mainly on renewable energy sources and supported by gas capacities.
The ORLEN Group is a significant producer of electricity and heat, which is largely used for its own production needs, and is also one of the main distributors of electricity in Poland. It is also one of the largest gas consumers in Poland and an active participant in the gas market liberalization process.
GRI Disclosures:
SDGs:
-
Goal 7
-
Goal 9
-
Goal 11
-
Goal 12
-
Goal 13
Capitals:
-
103-1
-
103-2
-
103-3
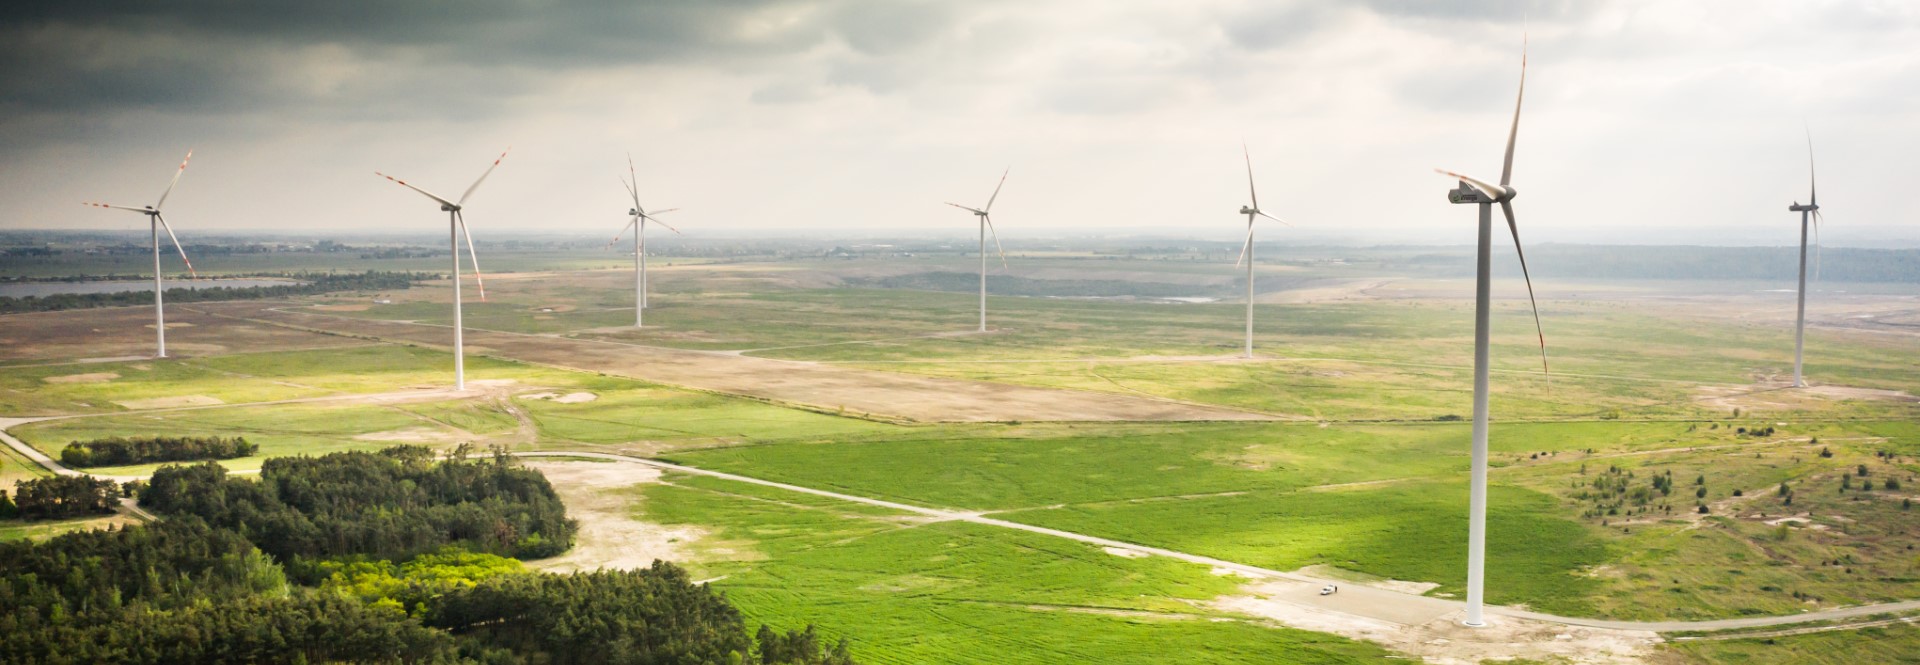
The ORLEN Group currently has power units in three countries. In Poland there are, among others, in Płock, Włocławek, Ostrołęka, Elbląg, Kalisz, Jedlicz and Trzebinia, in the Czech Republic in Litvinov, Libiš, Kolin and Pardubice, and in Lithuania in Możejki. The ORLEN Group owes its strong position in terms of the share of electricity from renewable sources in the total energy generated mainly to the production of energy in hydroelectric plants and wind farms belonging to the Energa Group and ORLEN Wind 3. Green energy is also produced in installations burning biomass (in Energa Elektrownie Ostrołęka and Energa Kogeneracja) and in three solar farms.
More information on the ORLEN Group’s energy assets and projects in progress is available in the `Energy` section.
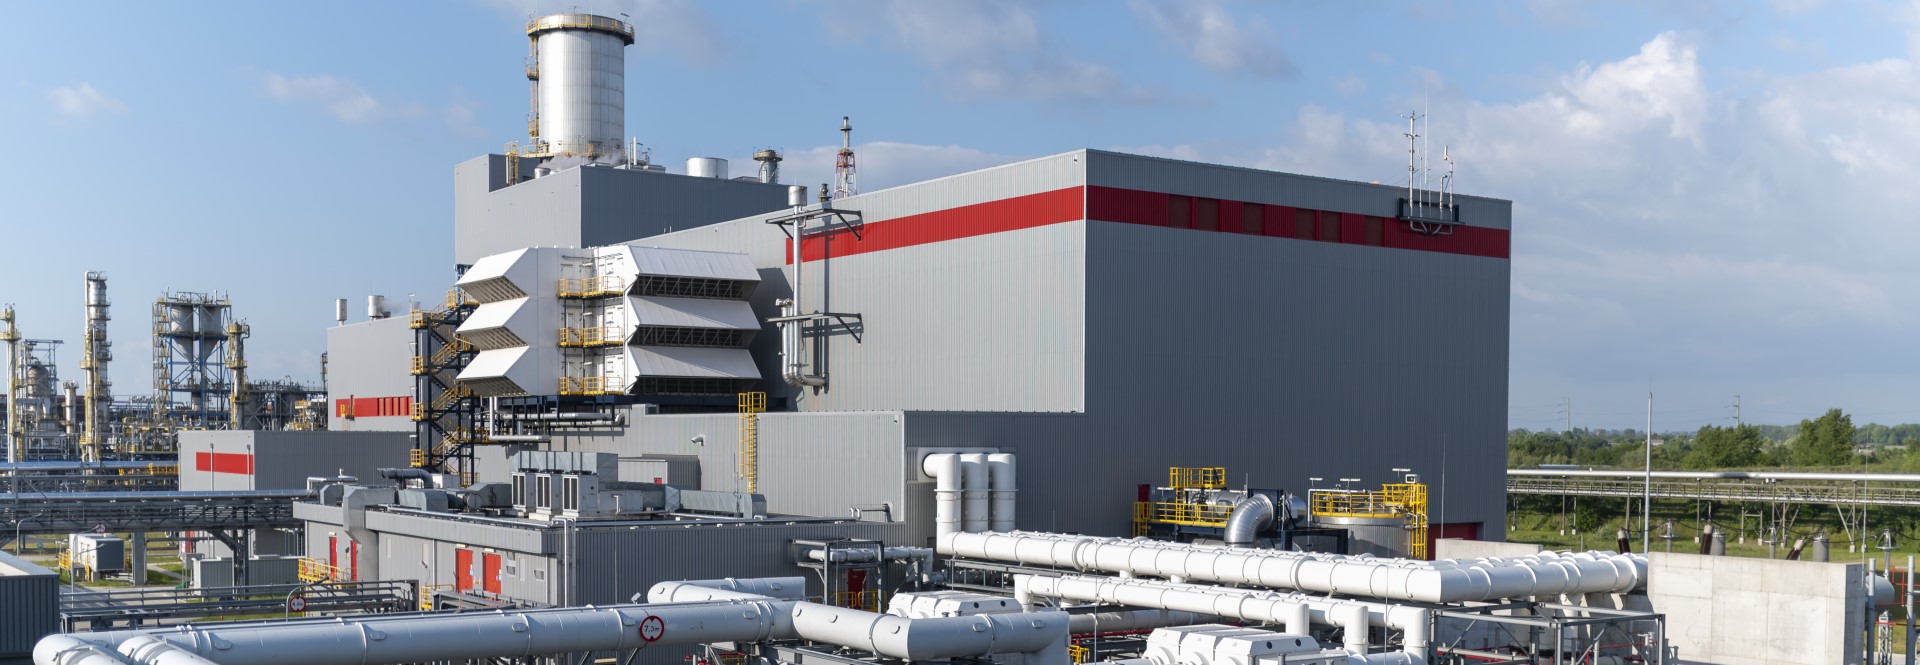
By 2030, the Company intends to achieve over 2.5 GW of installed capacity in renewable sources (calculated according to the ORLEN Group’s share in installed capacity). At least 1.7 GW will be provided by offshore wind farms, and 0.8 GW by onshore sources – wind farms and photovoltaics. The ORLEN Group will also increase the installed capacity in modern gas power plants from 1.1 GW to over 2.0 GW. The generation capacity will be supplemented by an extensive, modern distribution network of the ORLEN Group, providing access to a wide range of customers and generating stable profits. The concern will also implement pilot energy storage facilities, enabling optimization of electricity distribution costs.
For more information on the development of the Energy segment, see Strategy 2030.
Main energy KPIs at PKN ORLEN and the ORLEN Group.
Indicator calculations are based on the energy assets of the ORLEN Group. Major assets by country:
- Poland: PKN ORLEN’s CHP plant in Płock, CCGT unit in Płock and CCGT unit in Włocławek; ANWIL’s CHP plant; ORLEN Południe’s CHP plant in Trzebinia and CHP plant in Jedlicze; Energa Group’s generating units, including Ostrołęka Power Plant B, renewable energy sources (hydroelectric power plants, wind farms, solar power plants);
- Lithuania: CHP plant in Mažeikiai;
- Czech Republic: CHP plant in Litvinov.
The 2020 data is for the whole year, except for the Energa Group, for which the data covers the period after the company joined the ORLEN Group, i.e. from May 1st to December 31st 2020. The 2021 data for the wind farms owned by Orlen Wind 3 cover the period from the consolidation of individual farms in the ORLEN Group.
Energy consumption by type of energy source
-
302-1
The indicator was calculated as the difference between total chemical energy used in fuel plus energy purchased from the ORLEN Group’s third-party suppliers and sales of heat and electricity to customers outside the ORLEN Group.
Energy consumption by type of energy source
| ORLEN Group | 2021 | 2020 | ||
|---|---|---|---|---|
| Value [GJ] | Value [MWh] | Value [GJ] | Value [MWh] | |
| Energy consumption in fuels | 127,109,144 | 35,308,096 | 122,710,174 | 34,086,160 |
| Electricity purchased | 87,802,638 | 24,389,622 | 57,981,914 | 16,106,087 |
| Heat purchased | 169,386 | 47,052 | 12,186 | 3,385 |
| Electricity sold | 111,774,896 | 31,048,582 | 83,978,114 | 23,327,254 |
| Heat sold | 6,776,557 | 1,882,377 | 5,282,174 | 1,467,271 |
| Total consumption | 96,529,714 | 26,813,810 | 91,443,986 | 25,401,107 |
Installed capacity, broken down by primary energy source
-
G4 EU1
The indicator is calculated as installed capacity broken down by primary energy source.
| Breakdown by primary fuels | ORLEN Group 2021 | ORLEN Group 2020 | ||
|---|---|---|---|---|
| MWe (electrical capacity) |
MWt (thermal capacity) |
MWe (electrical capacity) |
MWt (thermal capacity) |
|
| Natural gas | 1,175 | 1,583 | 1,174 | 1,583 |
| Multi-fuel(Fuel oil/natural gas) | 522 | 3,255 | 522 | 3,255 |
| Lignite | 106 | 768 | 106 | 768 |
| Hard coal | 755 | 541 | 755 | 538 |
| Biomass | 25 | 59 | 25 | 59 |
| Wind power plants | 353 | – | 242 | – |
| Solar power plants | 12 | – | 6 | – |
| Hydroelectric power plants (including ESP Żydowo) | 359 | – | 359 | – |
| TOTAL | 3,306 | 6,206 | 3,188 | 6,203 |
| Power plants | 1,414 | 0 | 1,297 | 0 |
| CHP plants | 1,892 | 6,031 | 1,891 | 6,028 |
| Heat plants | 0 | 175 | 0 | 175 |
| TOTAL | 3,306 | 6,206 | 3,188 | 6,203 |
Net energy output broken down by primary energy source
-
G4 EU2
The indicator is calculated as net energy output broken down by primary energy source.
| Breakdown by primary fuels | ORLEN Group 2021 | ORLEN Group 2020 | ||
|---|---|---|---|---|
| Electricity [MWh] |
Heat [GJ] |
Electricity [MWh] |
Heat [GJ] |
|
| Natural gas | 5,161,380 | 7,103,206 | 6,727,858 | 7,690,250 |
| Multi-fuel(Fuel oil/natural gas) | 1,609,237 | 26,089,673 | 1,677,079 | 25,865,443 |
| Biogas | 3,391 | – | 7,221 | – |
| Lignite | 583,753 | 6,244,240 | 512,769 | 6,050,437 |
| Hard coal | 2,392,367 | 3,122,378 | 1,140,207 | 1,607,874 |
| Biomass | 76,128 | 695,298 | 104,765 | 491,222 |
| Wind power plants | 661,897 | – | 269,294 | – |
| Solar power plants | 5,050 | – | 3,618 | – |
| Hydroelectric powet plants (including ESP Żydowo) | 935,067 | – | 507,374 | – |
| Total | 11,428,269 | 43,254,796 | 10,950,185 | 41,705,227 |
Average generation efficiency of CHP plants by energy source and regulatory requirements
-
G4 EU11
The total generation efficiency was calculated as the quotient of total net energy output (electricity and/or heat) and the volume of fuel supplied, broken down by primary energy source. The electricity generation efficiency was calculated as net electricity output divided by the volume of fuel supplied for electricity generation (in the case of cogeneration units, established based on the physical division, i.e., in proportion to the heat and electricity volume generated), broken down by primary energy source.
Average generation efficiency of CHP plants by energy source and regulatory requirements
| 2021 | |||||
|---|---|---|---|---|---|
| ORLEN Group | |||||
| Efficency of electricity generation by thermal plants (%) | 60.52% | ||||
| Total generation efficency of thermal plants (%) | 66.40% | ||||
| Efficency of electricity generation by thermal plants (%) broken down by primary fuel: |
|
||||
| Multi-fuel (Fuel oil/natural gas) | 77.73% | ||||
| lignite | 59.34% | ||||
| natural gas | 52.83% | ||||
| hard coal | 78.66% | ||||
| Biomass | 70.29% | ||||
| Efficency of electricity generation by CHP plants (%) | 60.52% | ||||
| Efficency of electricity generation by power plants (%) | 86.02% |
Amounts of fuel for electricity generation by cogeneration units were established based on the physical method. Consistency of the 2020 data has been ensured.

Total investments in renewable energy
-
OG2
| ORLEN Group 2021 | |
|---|---|
| Investments in renevable energy [PLN thousand] | 704,983 |
Energy sold by source
| ORLEN Group 2021 | |
|---|---|
| Electricity from own sources [MWh] | 7,645,999 |
| Electricity purchased from third-party suppliers (from outside the ORLEN Group) [MWh] | 23,402,583 |
| Heatfrom own sources [GJ] | 6,766,290 |
| Heat purchased from third-party suppliers (from outside the ORLEN Group) [GJ] | 10,267 |
Net energy output from renewable energy sources
The indicator includes electricity produced by wind, solar, biomass-fired and biogas-fired sources and hydroelectric power plants. Production from the Żydowo pumped-storage power plant has not been included.
| ORLEN Group 2021 | |
|---|---|
| Eelctricity [MWh] | 1,614,333 |
| Heat[GJ] | 695,298 |
Total gross renewable electricity output at the Total gross renewable electricity output at the ORLEN Group (excluding Żydowo pumped-storage power plant) in 2021 was 1,667,205.57 MWh.
Number of installed EV chargers and number of charging hours
| ORLEN Group 2021 | |
|---|---|
| Number of EV chargers | 445 |
| Number of charging hours [h] | 42,000 |
Number of installed chargers as at the end of 2021: 445. Number of chargers in use: 420.