Charts and tables centre

| XLS | CSV | PNG | JPG | ||
|---|---|---|---|---|---|
| Selected financial-operating highlights of 2017-2021 | Download | Download | Download | ||
| Selected items of the consolidated statement of profit or loss and other comprehensive income | Download | Download | Downlaod | ||
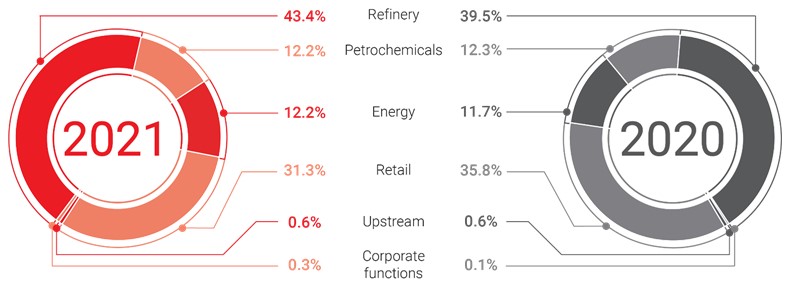
| ORLEN Group revenue by segment | Download | Download | |||
| TOP10 products in terms of revenue in 2021 | Download | Download | Download | ||
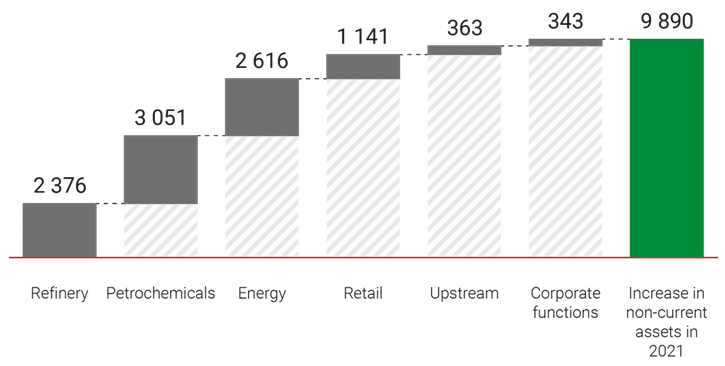
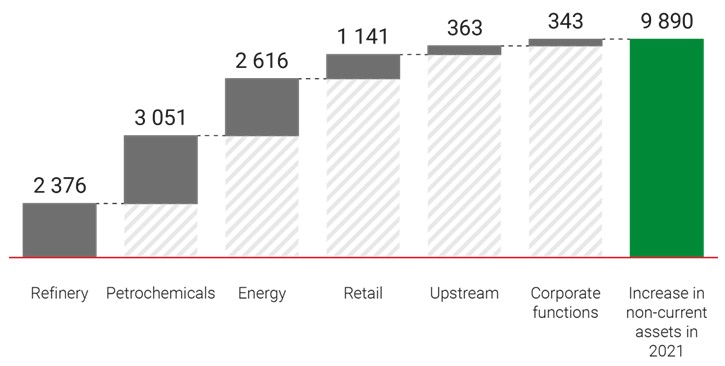
| Increase in non-current assets in 2021 [PLN million] | Download | Download | |||
| Energy | |||||
| Financial highlights of the Energy segment | Download | Download | Download | ||
| Refinery segment | |||||
| Financial highlights of the Refinery segment | Download | Download | Download | ||
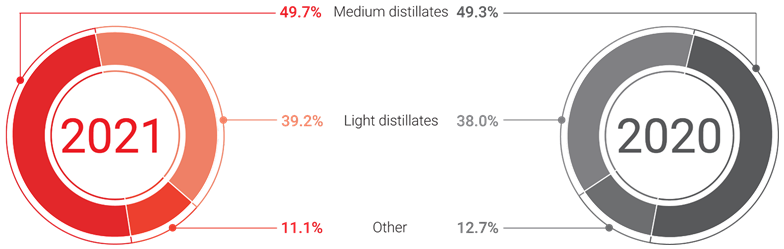
| Sales of the ORLEN Group Refinery segment [PLN million / '000 tonnes] | Download | Download | Download | ||
| Sales volume of the ORLEN Group Refinery segment in home markets1) [PLN million / '000 tonnes] | Download | Download | Download | ||
| Petrochemicals | |||||
| Financial highlights of the Petrochemicals segment | Download | Download | Download | ||
| Sales of the ORLEN Group’s Petrochemicals segment [PLN million / '000 tonnes] | Download | Download | Download | ||
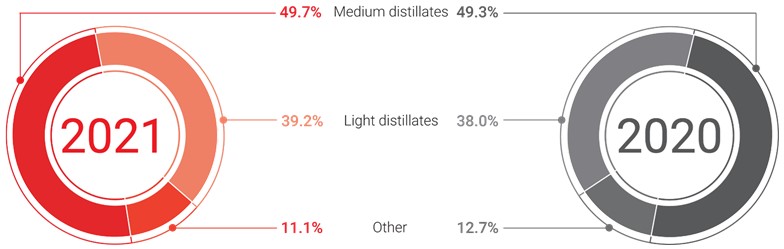
| Revenue structure of the ORLEN Group Petrochemicals segment | Download | Download | |||
| Sales volume of the ORLEN Group Petrochemicals segment in home markets1) [PLN million / '000 tonnes] | Download | Download | Download | ||
| Retail segment | |||||
| Financial highlights of the Retail segment | Download | Download | Download | ||
| Sales of the ORLEN Group Retail segment [PLN million/’000 tonnes] | Download | Download | Download | ||
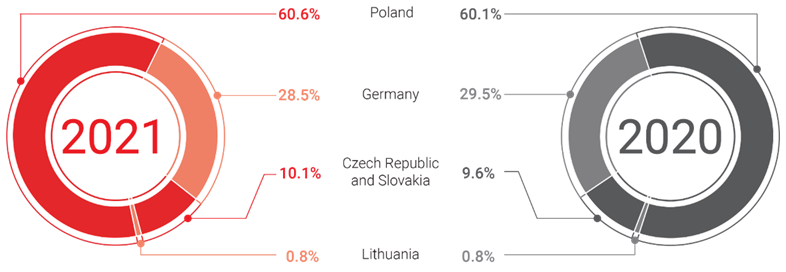
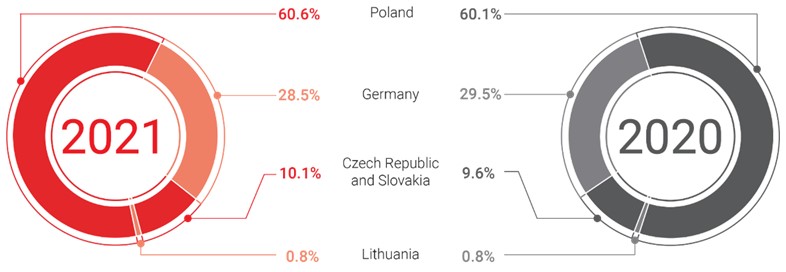
| Revenue structure of the ORLEN Group Retail segment | Download | Download | |||
| Sales volume of the ORLEN Group Retail segment in home markets [‘000 tonnes] | Download | Download | Download | ||
| Sales structure of the ORLEN Group Retail segment in the home markets | Download | Download | |||
| Upstream segment | |||||
| Financial highlights of the Upstream segment | Download | Download | Download | ||
| Sales volume of the ORLEN Group Upstream segment [PLN million/’000 tonnes] | Download | Download | Download | ||
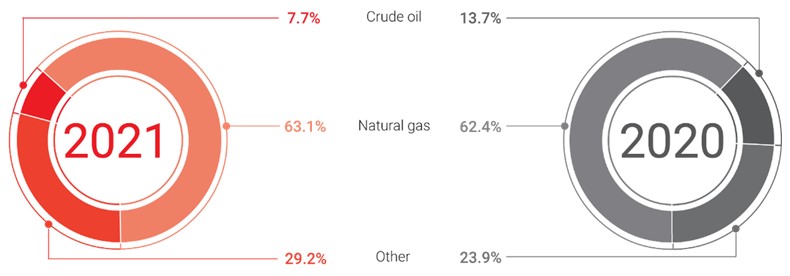
| Sales structure of the ORLEN Group Upstream segment | Download | Download | |||
| Corporate functions | |||||
| Financial highlights of the Corporate functions segment | Download | Download | Download | ||
| ORLEN Group headcount | |||||
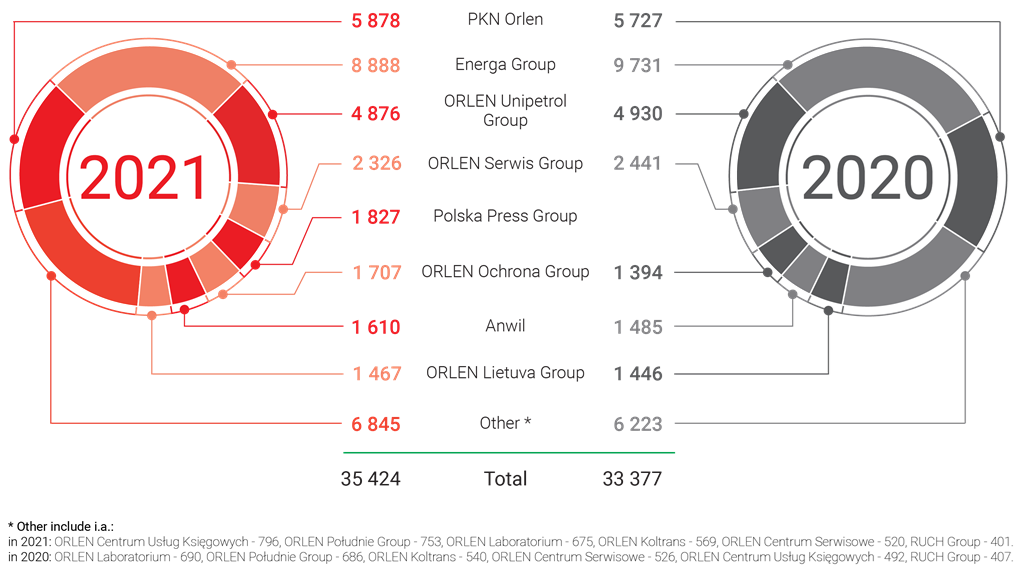
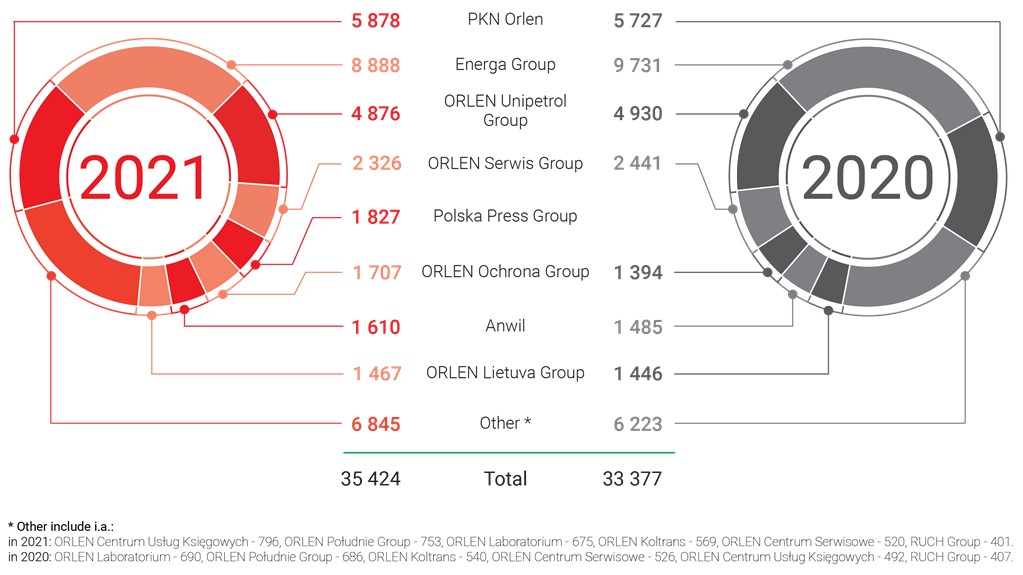
| ORLEN Group headcount as at December 31st 2021 and 31st 2020 | Download | Download | |||
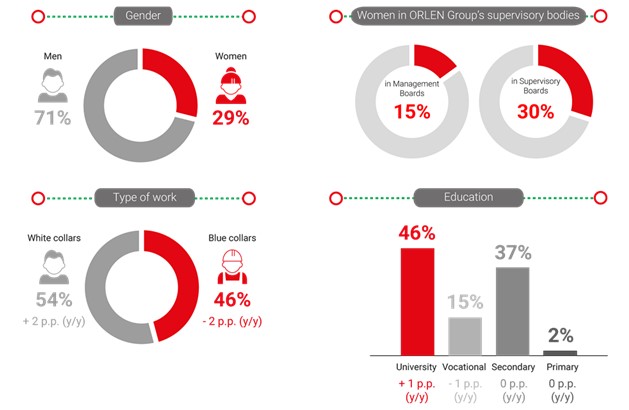
| ORLEN Group workforce structure | Download | Download | |||
| Accident rates in the ORLEN Group | |||||
| TRR and T1 PSER indicators at the ORLEN Group | Download | Download | Download | ||
| Safety Culture Indicator at the ORLEN Group | Download | Download | Download | ||
1) By country of establishment of the relevant company.